So to my project, at first I wanted to find all country names in one file. Since we are in 2015 it wasn't hard and I found more then I need. There is some nice things going on on github. And there is nice piece of data out there in this repo World countries in JSON, CSV and XML and Yaml
Unfortunately I found that repo has also geojson data so I thought it would be nice to draw country with code. After a while and some another searching since almost everything now is partly or all online I was at home reading this blog post.
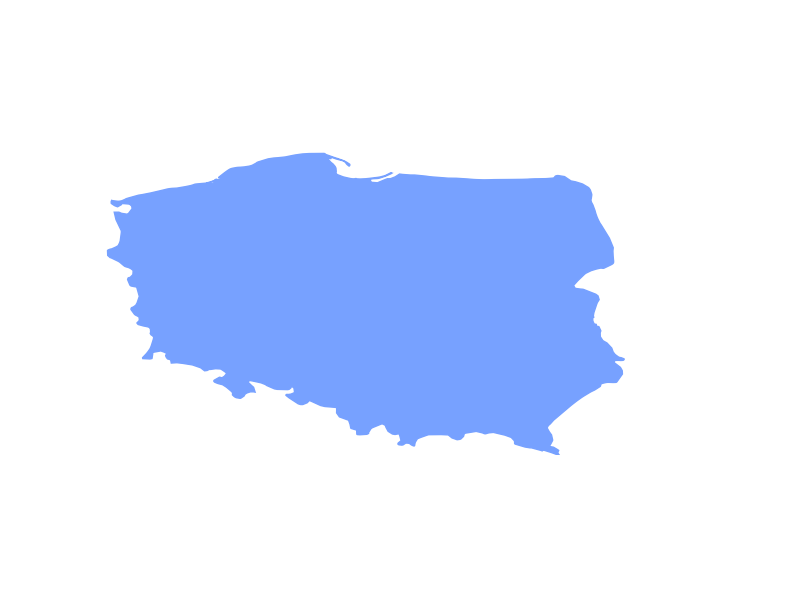
Since my experience with matplotlib is 1 using scale from 1 to 10 I also verified some methods with this one. Finally after modified some code to work with data on my drive instead from some third party cloud I had a Poland Borders.
Happy but something was missing. How about USA bigger one? And they were using MultiPolygon to write it's borders. More modifying USA came up.

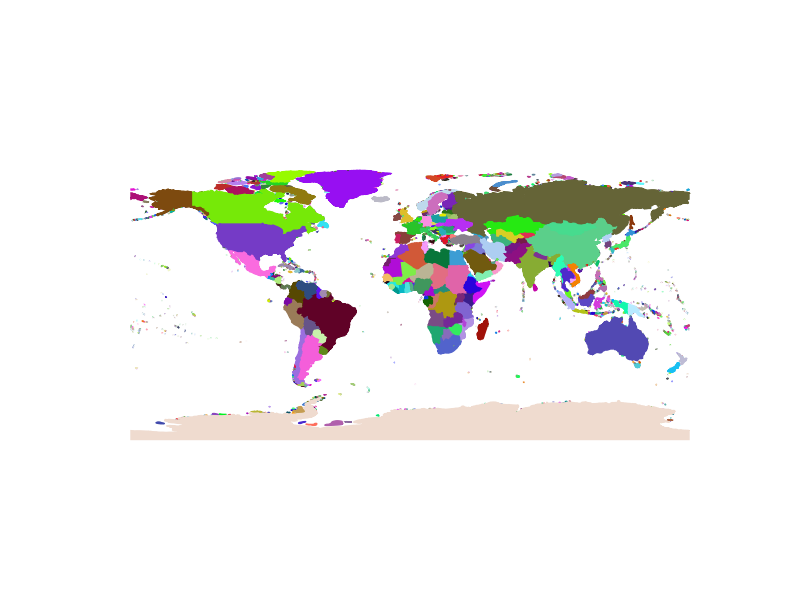
On this success run, with some more time I modified that code to draw whole world using all country files provided and save it as PNG image. That was a little more challenging but at least leaned more about matplotlib itself ;)
How to run code I provided.
To install libraries follow the blog post I mentioned above.
To run code You will also need data from github repo I also wrote about in this post.
Finally running code :
The main method is start (line 48) that at first gets all files from data directory that is hard-coded at the beginning of the file (line 10). It should point to data directory from github repo.
So method at the beggining (line 16) basically filter file names with json extension.
Then in the loop method start (line 56 ) I get the file content and draw it on one figure that's declared as fig (line 53).
At the end I save the file in script directory under name 'world.png'
And here's how the random colored world looks like.
Feel free to try it yourself using this code
#!/usr/bin/python
# -*- coding: utf-8 -*-

from matplotlib import pyplot as plt
from descartes import PolygonPatch
import simplejson
import os

#https://github.com/mledoze/countries/data
BASE_PATH = "your path to data folder"

# some random 0-255 utility
r = lambda: random.randint(0,255)

# get all files from path of given extension
def getFiles(path, ext):
    dir = os.listdir(path)
    k = len(dir)
    i = 0
    while i != k:
        f = dir[i]
        if f[len(f)-4:] != ext:
            dir.pop(i)
            i-=1
        i+=1
        k = len(dir)
    return dir

# get json from file
def getJSON(path):
    f = open(path)
    return simplejson.loads(f.read())

# plot path
def plotFeature(fig, geom):
    if geom['type'] == 'Polygon':
        poly = geom
        color = '#%02X%02X%02X' % (r(),r(),r())
        fig.add_patch(PolygonPatch(poly, fc=color, ec=color,
                                   alpha=1, zorder=2))
    elif geom['type'] == 'MultiPolygon':
        for c in geom['coordinates']:
            poly = {"type": "Polygon", "coordinates": c}
            #print "add path"
            color = '#%02X%02X%02X' % (r(),r(),r())
            fig.add_patch(PolygonPatch(poly, fc=color, ec=color,
                                       alpha=1, zorder=2))

def start():
    files = getFiles(BASE_PATH, 'json')
    print(files)

    #create figure
    fig = plt.subplot()

    # list directory files
    for f in files:
        path = BASE_PATH+f
        # get json data
        pydata = getJSON(path)

        print "draw : "+f
        # check if has geometry
        if pydata['features'][0].has_key('geometry'):
            geom = pydata['features'][0]['geometry']
            print geom['type']
            plotFeature(fig, geom)
    # scale and remove axis
    fig.axis('scaled')
    fig.axis('off')
    #save the plot as an image
    plt.savefig('world.png')


if __name__ == "__main__":
    start()